4QFY2018 Result Update | Plywood
May 19, 2018
Century Plyboards Ltd
Neutral
CMP
`269
Performance Update
Target Price
-
(Rs cr)
4QFY18
4QFY17
% yoy
3QFY17
% qoq
Revenue
544
526
3.5
510
6.7
Stock Info
EBITDA
83
84
(0.7)
88
(5.3)
Sector
Plywood
Market Cap (` cr)
5,976
OPM (%)
15.3%
15.9%
17.2%
Net Debt (` cr)
780
Adjusted PAT
36
56
(36.1)
47
(23.4)
Beta
0.9
Source: Company, Angel Research
52 Week High / Low
364/235
For 4QFY2018, Century Plyboards Ltd. (CPIL) underperformed both on the top
Avg. Daily Volume
36,577
line and bottom line front. Total revenue for the quarter remained flat at `544cr
Face Value (`)
10
BSE Sensex
33,812
compared to `526cr for the year ago period. Operating margin contracted by
Nifty
10,442
60bps on account of increase in raw material cost. On the bottom line front, CPIL
Reuters Code
CNTP.BO
reported a decline of ~36% yoy to `35cr.
Bloomberg Code
CPBI.IN
Top-line remains flattish: Company’s top line reported a lower growth of ~3% to
Shareholding Pattern (%)
`544cr on the back of poor performance in company prime segment i.e. Century
Promoters
72.0
MF / Banks / Indian Fls
4.7
Plywood and Particle board. Century Plywood segment de-grew by ~13.7% yoy
FII / NRIs / OCBs
11.5
during the quarter, whereas Particle Board segment reported a decline of ~7.2%
Indian Public / Others
11.8
yoy. Company’s other products such as Laminate products and Container Frieght
Abs.(%)
3m
1yr
3yr
Station Services also underperformed.
Sensex
7.4
27.1
22.9
Higher input costs impacted overall profitability: On the operating front, the
CPIL
(17.5)
3.5
51.8
company margin contracted by 60bps on account of higher raw material costs.
On the bottom line front, company’s Profit after Tax declined by ~36% to `35cr
mainly due to the increase in depreciation cost and interest rates.
Outlook & Valuation: We expect CPIL to report top-line CAGR of ~11% to
`2,537cr over FY18-20E. On the bottom-line front, we estimate ~18% CAGR to
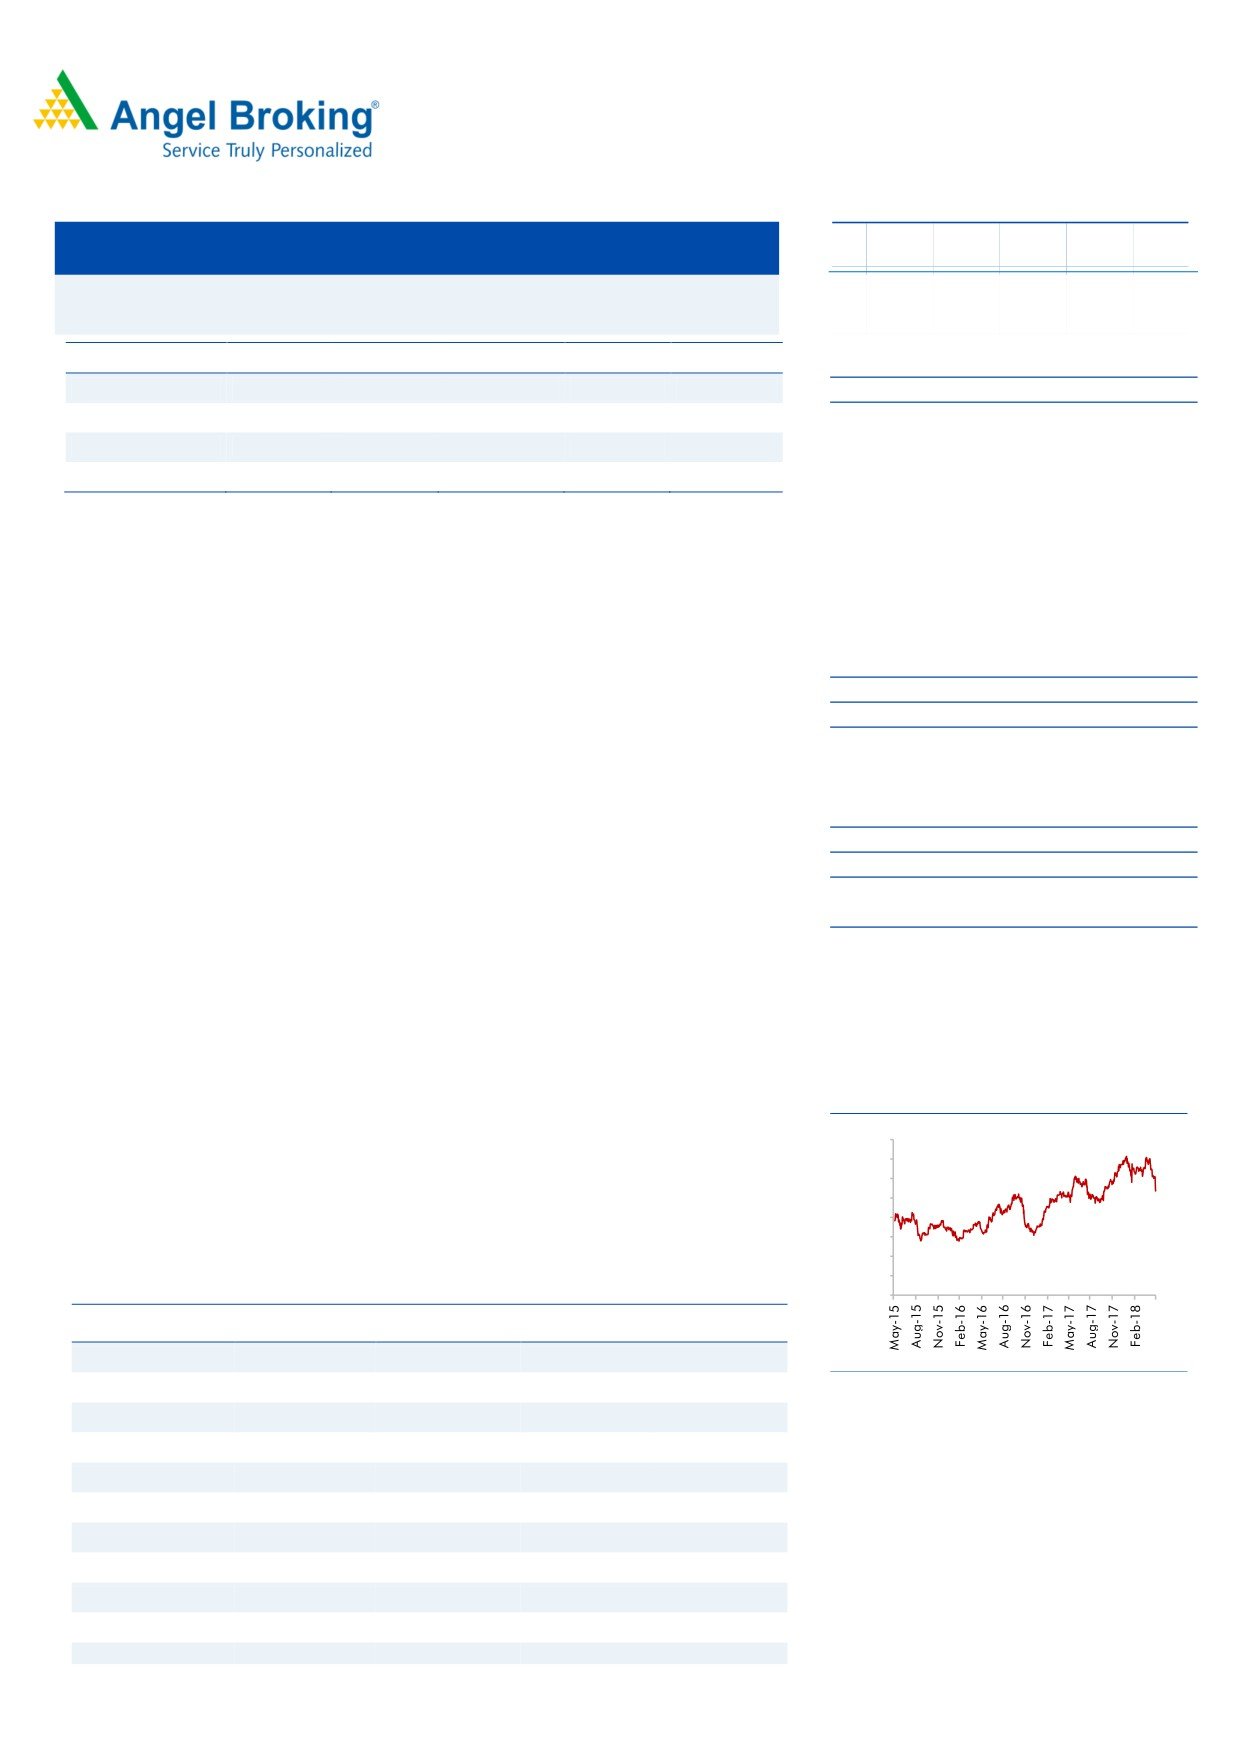
3-year price chart
`230cr over the same period. Considering the overall poor performance of
400
350
4QFY18 results and depreciation of currency by 10% since Jan 2018 which would
300
further impact the overall profitability (as company imports 50% raw material), we
250
200
maintain Neutral rating on CPIL.
150
100
50
Key Financials
0
Y/E March (`cr)
FY2017
FY2018
FY2019E
FY2020E
Net Sales
1,819
2,060
2,307
2,538
Source: Company, Angel Research
% chg
10.8
13.3
12.0
10.0
Net Profit
193
166
199
230
% chg
14.0
(14.1)
19.6
15.9
OPM (%)
17.2
16.1
17.0
17.3
EPS (`)
8.7
7.5
8.9
10.4
P/E (x)
31.0
36.1
30.2
26.1
Amarjeet S Maurya
P/BV (x)
8.4
7.0
5.9
5.1
022-39357800 Ext: 6831
RoE (%)
27.1
19.3
19.6
19.4
RoCE (%)
18.9
14.7
16.0
16.5
EV/Sales (x)
3.6
3.3
2.9
2.6
Please refer to important disclosures at the end of this report
1
Century Plyboards Ltd | 4QFY2018 Result Update
Exhibit 1: 4QFY2018 Performance
Y/E March (`cr)
4QFY18
4QFY17
% yoy
3QFY18
% qoq
FY2018
FY2017
% chg
Net Sales
544
526
3
510
6.7
2,002
1,920
4.3
Consumption of RM
274
253
8.2
261
5.0
1,023
918
11.4
(% of Sales)
50.3
48.1
51.1
51.1
47.8
Staff Costs
75
67
12.7
72
4.0
284
257
10.6
(% of Sales)
13.8
12.7
14.2
14.2
13.4
Other Expenses
112
122
(8.4)
89
25.5
389.11
454
(14.2)
(% of Sales)
20.6
23.2
17.5
19.4
23.6
Total Expenditure
461
442
4.3
422
9.2
1,696
1,628
4.2
Operating Profit
83
84
(0.7)
88
(5.3)
306
292
4.8
OPM
15.3
15.9
17.2
15.3
15.2
Interest
12.2
2.6
377.3
6.3
94.5
33
29
14.1
Depreciation
27.7
15.6
78.2
26.3
5.4
81
52
54.7
Other Income
1
14
4
7
23
PBT (excl. Ext Items)
45
80
(44.2)
59
(25.1)
199
234
(14.8)
Ext (Income)/Expense
PBT (incl. Ext Items)
45
80
(44.2)
59
(25.1)
199
234
(14.8)
(% of Sales)
8.2
15.2
11.7
9.9
12.2
Provision for Taxation
9
24
13
42
48
(% of PBT)
19.8
30.0
21.5
21.3
20.6
Reported PAT
35.72
55.91
(36.1)
46.66
(23.4)
156.64
185.56
(15.6)
Other Comprehensive Income
0
(0)
-
(0)
-
Total Comprehensive Income
36.09
55.64
(35.1)
46.40
(22.2)
Source: Company, Angel Research
May 19, 2018
2
Century Plyboards Ltd | 4QFY2018 Result Update
Outlook & Valuation: We expect CPIL to report top-line CAGR of ~11% to
`2,537cr over FY18-20E. On the bottom-line front, we estimate ~18% CAGR to
`230cr over the same period. Considering the overall poor performance of
4QFY18 results and depreciation of currency by 10% since Jan 2018 which would
further impact the overall profitability (as company imports 50% raw material), we
maintain Neutral rating on CPIL.
Downside risks to our estimates
Given that the Company has significant forex exposure on account of majority
raw materials being imported from other countries, in addition to ECB loans,
any unfavorable change in currency may pose forex risks, which could
significantly impact margins.
Recently, the company has added a new MDF plant with capex of `380cr; any
slowdown in MDF market can impact the company’s earnings due to higher
fixed cost overheads.
Company Background
Century Plyboards (India) Ltd (CPIL) is a plywood manufacturer. The company's
segments include plywood, laminate, CFS services and others. The company's
geographical segments are India and overseas. The plywood segment includes
plywood, block-board, veneer and timber. The laminate segment includes
decorative laminates and pre-laminated boards. The CFS services segment
includes container freight station services. The others segment includes mainly
trading of chemicals, minerals, readymade furniture and equipments. The
company's product portfolio includes doors, decorative veneer, new age products
(NAP), fiber cement boards, particle boards, look book, slimline, mono core,
magnetic laminates and prelaminated boards. CPIL is also engaged in the logistics
business through the management of a container freight station. The Company's
units are spread across India in Joka (West Bengal), Guwahati (Assam), Kandla
(Gujarat), Chennai (Tamil Nadu) and Karnal (Haryana).
May 19, 2018
3
Century Plyboards Ltd | 4QFY2018 Result Update
Consolidated Profit & Loss Statement
Y/E March (`cr)
FY2017
FY2018
FY2019E
FY2020E
Total operating income
1,819
2,060
2,307
2,538
% chg
10.8
13.3
12.0
10.0
Total Expenditure
1,507
1,729
1,915
2,099
Raw Material
895
986
1,107
1,231
Personnel
273
313
358
398
Others Expenses
339
430
450
470
EBITDA
312
331
392
439
% chg
7.8
6.1
18.5
11.9
(% of Net Sales)
17.2
16.1
17.0
17.3
Depreciation& Amortisation
59
91
108
115
EBIT
253
240
285
324
% chg
4.4
(4.8)
18.4
13.8
(% of Net Sales)
13.9
11.7
12.3
12.8
Interest & other Charges
30
36
39
39
Other Income
23
8
9
10
(% of PBT)
9.2
3.7
3.5
3.4
Share in profit of Associates
-
-
-
-
Recurring PBT
245
212
255
295
% chg
22.4
(13.3)
20.0
15.9
Tax
52
46
56
65
(% of PBT)
21.0
21.8
22.0
22.0
PAT (reported)
193
166
199
230
Minority Interest (after tax)
-
-
-
-
Profit/Loss of Associate Company
-
-
-
-
ADJ. PAT
193
166
199
230
% chg
14.0
(14.1)
19.6
15.9
(% of Net Sales)
10.6
8.1
8.6
9.1
Basic EPS (`)
8.7
7.5
8.9
10.4
Fully Diluted EPS (`)
8.7
7.5
8.9
10.4
% chg
14.0
(14.1)
19.6
15.9
May 19, 2018
4
Century Plyboards Ltd | 4QFY2018 Result Update
Consolidated Balance Sheet
Y/E March (`cr)
FY2017
FY2018
FY2019E
FY2020E
SOURCES OF FUNDS
Equity Share Capital
22
22
22
22
Reserves& Surplus
693
837
991
1,166
Shareholders Funds
715
859
1,013
1,188
Minority Interest
12
12
12
12
Total Loans
619
780
770
770
Deferred Tax Liability
1
1
1
1
Total Liabilities
1,347
1,652
1,796
1,971
APPLICATION OF FUNDS
Gross Block
412
924
948
973
Less: Acc. Depreciation
106
197
304
420
Net Block
306
727
643
553
Capital Work-in-Progress
299
299
299
299
Investments
6
6
6
6
Current Assets
905
842
1,094
1,352
Inventories
301
339
398
445
Sundry Debtors
342
389
449
501
Cash
67
21
60
127
Loans & Advances
160
60
150
228
Other Assets
35
33
37
51
Current liabilities
238
291
315
308
Net Current Assets
667
551
779
1,044
Deferred Tax Asset
69
69
69
69
Mis. Exp. not written off
-
-
-
-
Total Assets
1,347
1,652
1,796
1,971
May 19, 2018
5
Century Plyboards Ltd | 4QFY2018 Result Update
Consolidated Cash flow Statement
Y/E March (`cr)
FY2017
FY2018
FY2019E FY2020E
Profit before tax
245
212
255
295
Depreciation
59
91
108
115
Change in Working Capital
(54)
70
(189)
(198)
Interest / Dividend (Net)
30
36
39
39
Direct taxes paid
(43)
(46)
(56)
(65)
Others
(17)
0
0
0
Cash Flow from Operations
221
362
156
186
(Inc.)/ Dec. in Fixed Assets
(305)
(512)
(24)
(25)
(Inc.)/ Dec. in Investments
0
0
0
0
Cash Flow from Investing
(304)
(512)
(24)
(25)
Issue of Equity
0
0
0
0
Inc./(Dec.) in loans
142
162
(10)
0
Dividend Paid (Incl. Tax)
(0)
(22)
(45)
(56)
Interest / Dividend (Net)
(30)
(36)
(39)
(39)
Cash Flow from Financing
112
103
(93)
(94)
Inc./(Dec.) in Cash
28
(46)
39
67
Opening Cash balances
39
67
21
60
Closing Cash balances
67
21
60
127
May 19, 2018
6
Century Plyboards Ltd | 4QFY2018 Result Update
Key Ratios
Y/E March
FY2017
FY2018
FY2019E
FY2020E
Valuation Ratio (x)
P/E (on FDEPS)
31.0
36.1
30.2
26.1
P/CEPS
23.7
23.4
19.6
17.4
P/BV
8.4
7.0
5.9
5.1
Dividend yield (%)
0.9
0.4
0.7
0.9
EV/Sales
3.6
3.3
2.9
2.6
EV/EBITDA
21.0
20.4
17.1
15.1
EV / Total Assets
4.9
4.1
3.7
3.4
Per Share Data (`)
EPS (Basic)
8.7
7.5
8.9
10.4
EPS (fully diluted)
8.7
7.5
8.9
10.4
Cash EPS
11.4
11.5
13.8
15.5
DPS
2.5
1.0
2.0
2.5
Book Value
32.1
38.6
45.5
53.4
Returns (%)
ROCE
18.9
14.7
16.0
16.5
Angel ROIC (Pre-tax)
20.0
14.9
16.6
17.7
ROE
27.1
19.3
19.6
19.4
Turnover ratios (x)
Asset Turnover (Gross Block)
4.4
2.2
2.4
2.6
Inventory / Sales (days)
60
60
63
64
Receivables (days)
69
69
71
72
Payables (days)
28
31
31
28
Working capital cycle (ex-cash) (days)
101
98
103
108
Source: Company, Angel Research
May 19, 2018
7
Century Plyboards Ltd | 4QFY2018 Result Update
Research Team Tel: 022 - 39357800
Website:
DISCLAIMER
This document is solely for the personal information of the recipient, and must not be singularly used as the basis of any
investment decision. Nothing in this document should be construed as investment or financial advice. Each recipient of
this document should make such investigations as they deem necessary to arrive at an independent evaluation of an
investment in the securities of the companies referred to in this document (including the merits and risks involved), and
should consult their own advisors to determine the merits and risks of such an investment.
Angel Broking Pvt. Limited, its affiliates, directors, its proprietary trading and investment businesses may, from time to
time, make investment decisions that are inconsistent with or contradictory to the recommendations expressed herein. The
views contained in this document are those of the analyst, and the company may or may not subscribe to all the views
expressed within.
Reports based on technical and derivative analysis center on studying charts of a stock's price movement, outstanding
positions and trading volume, as opposed to focusing on a company's fundamentals and, as such, may not match with a
report on a company's fundamentals.
The information in this document has been printed on the basis of publicly available information, internal data and other
reliable sources believed to be true, but we do not represent that it is accurate or complete and it should not be relied on
as such, as this document is for general guidance only. Angel Broking Pvt. Limited or any of its affiliates/ group
companies shall not be in any way responsible for any loss or damage that may arise to any person from any inadvertent
error in the information contained in this report. Angel Broking Pvt. Limited has not independently verified all the
information contained within this document. Accordingly, we cannot testify, nor make any representation or warranty,
express or implied, to the accuracy, contents or data contained within this document. While Angel Broking Pvt. Limited
endeavours to update on a reasonable basis the information discussed in this material, there may be regulatory,
compliance, or other reasons that prevent us from doing so.
This document is being supplied to you solely for your information, and its contents, information or data may not be
reproduced, redistributed or passed on, directly or indirectly.
Angel Broking Pvt. Limited and its affiliates may seek to provide or have engaged in providing corporate finance,
investment banking or other advisory services in a merger or specific transaction to the companies referred to in this
report, as on the date of this report or in the past.
Neither Angel Broking Pvt. Limited, nor its directors, employees or affiliates shall be liable for any loss or damage that
may arise from or in connection with the use of this information.
Note: Please refer to the important `Stock Holding Disclosure' report on the Angel website (Research Section). Also,
please refer to the latest update on respective stocks for the disclosure status in respect of those stocks. Angel Broking Pvt.
Limited and its affiliates may have investment positions in the stocks recommended in this report.
Disclosure of Interest Statement Century Plyboard
1. Analyst ownership of the stock No
2. Angel and its Group companies ownership of the stock No
3. Angel and its Group companies' Directors ownership of the stock
No
4. Broking relationship with company covered
No
Note: We have not considered any Exposure below ` 1 lakh for Angel, its Group companies and Directors
Ratings (Returns):
Buy (> 15%)
Accumulate (5% to 15%)
Neutral (-5 to 5%)
Reduce (-5% to -15%)
Sell (< -15%)
May 19, 2018
8